
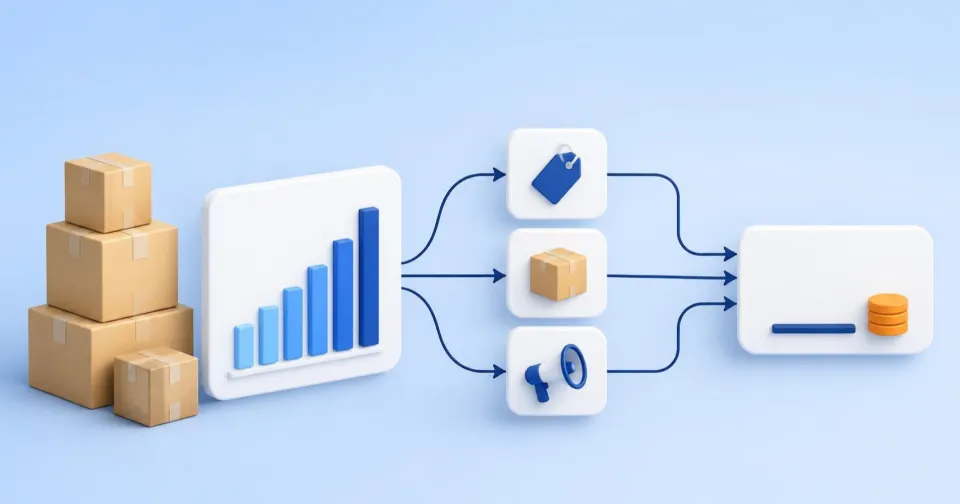
Revenue is the most visible number in an online store, so it drives many decisions. On its own, however, it does not say how much the business earned. The same revenue growth can come from new customers acquired at a sensible cost, from deeper discounts, from a shift towards cheaper low-margin products, or from advertising that pays more for every additional order. Before you accelerate growth, find out what it is made of.
Revenue is an outcome, not an explanation
For a growth decision, what remains after variable costs is more useful than revenue. Management accounting calls this the contribution margin: revenue minus the costs that rise with every additional sale. It first covers fixed costs and only then becomes profit.
In an online store, variable costs typically include the purchase cost of goods, performance marketing, shipping and packaging, payment fees and the cost of returns. Not every store has all of these in its data. For a first decision, the two largest are usually enough: the cost of goods sold and marketing spend. Together they give margin after marketing – gross margin minus marketing spend. It is not net profit, but it is the first number that shows whether growth is paying off.
An illustrative example with invented round numbers:
| Last year | This year | |
|---|---|---|
| Orders | 1,000 | 1,250 |
| Average order excl. VAT | CZK 1,000 | CZK 960 |
| Revenue excl. VAT | CZK 1,000,000 | CZK 1,200,000 |
| Gross margin | 35% = CZK 350,000 | 29% = CZK 348,000 |
| Marketing spend | CZK 100,000 (10% of revenue) | CZK 180,000 (15% of revenue) |
| Margin after marketing | CZK 250,000 | CZK 168,000 |
Revenue rose by 20% and orders by a quarter, yet after goods and marketing roughly a third less remained. An owner watching revenue alone would accelerate exactly the growth that is costing money.
Compare like with like first
Most false conclusions about growth come not from a wrong calculation but from an inconsistent baseline. Check three things before breaking growth down.
Revenue and costs excluding VAT. Shoptet can show turnover and average order value with or without VAT. A VAT-registered store usually reads marketing spend and purchase costs without tax. At the Czech standard rate of 21%, turnover including VAT is about a fifth higher than turnover excluding it, so cost ratios and margins calculated against gross turnover look better than they are.
The same scope of orders. Both periods must treat cancelled and returned orders and sales channels in the same way. Otherwise a change in bookkeeping looks like a change in the business.
Comparable periods and market. Compare the same number of days and the same season. The market helps too: the Czech Statistical Office reports retail sales at constant prices, adjusted for price changes, and according to its data online and mail-order retailers grew sales by 11.6% year on year in May 2026. That is one month and a whole segment, not a benchmark for your category. It does show that your own growth should be read against the market and separately from price increases.
Break growth into four causes
Volume: more orders or more units
More orders at stable prices and margins is the cleanest kind of growth. Even here it pays to separate new and returning customers. The same increase in orders means something different when it comes from loyal customers than when advertising had to buy every order again.
Price and discounts: revenue rises, margin thins
Discounts lift revenue easily and thin margin disproportionately fast. Illustratively: a product sells for CZK 100 excluding VAT and costs CZK 70, so the margin is CZK 30. After a 10% discount, CZK 20 is left per sale. To earn the same as before, the store must sell 50% more units. The same logic works in reverse: a price increase of a few percent can materially improve the result if volume holds. Compare average selling price and the share of discounted orders across both periods.
Mix: selling more, but different goods
When growth comes mainly from a low-margin category, revenue rises and the average margin falls even though neither prices nor costs changed. Management accounting therefore separates the mix effect from the volume effect. Mix only changes the result when products carry different margins, and the revenue split between categories can hide a change in mix. In practice, split revenue growth by category or product group and show the gross margin of each.
Cost of creating the sale: each extra order costs more
Marketing rarely scales in a straight line. The first part of a budget captures the cheapest demand; further spend buys increasingly expensive sales. The decisive question is not whether campaigns “have a good ratio”, but what the additional revenue costs and how much of it is left after margin.
Watch for two traps. First, standard advertising metrics work with revenue. PNO in Sklik – the cost-to-revenue ratio common in Czech e-commerce – divides click costs by the revenue from goods sold, and ROAS in Google Ads divides conversion value by cost. Google Ads can report gross profit only once cart data and product costs are supplied. The same 15% cost-to-revenue ratio is comfortable for goods with a 45% margin and consumes the entire margin for goods with a 15% margin.
The second trap is attribution. Revenue credited by an ad platform is not the same as revenue the advertising caused. Field experiments at eBay showed that the true return on paid search was a fraction of conventional non-experimental estimates, and a comparison of 15 experiments at Facebook found that common observational methods often failed to match randomised tests. Both studies come from large US advertisers, so the size of the error cannot be transferred to a Czech store. They are reason enough to set marketing spend against the store’s total revenue and margin, not only against platform-credited revenue.
Revenue and margin in one place
See revenue, gross margin, ad spend and margin after advertising for the same period, excluding VAT.
When more expensive growth is fine
A lower margin after marketing is not necessarily a bad decision. A customer’s value derives from future earnings based on how often they return and at what margin they buy, and the value of the whole customer base also depends on what it costs to acquire them. A more expensive first purchase can therefore pay off if new customers demonstrably come back.
The key word is demonstrably. Without data on repeat purchases by new customers, “investing in growth” is only a hypothesis. Write it down with a review date: for example, how many new customers from a given period buy again within six months. If they do not, it was an expensive one-off sale, not an investment.
What the data cannot show
Gross margin is only as good as the purchase costs in the system. Shoptet calculates profit margin only for products with a purchase price filled in, so products without one distort the margin. Before comparing periods, check what share of revenue has a purchase price recorded.
Be equally honest about costs missing from the data: shipping, payment fees, returns, warehousing or wages. Do not fill them with an estimated percentage just to produce a “net profit”. A precise-looking number built on a guess suggests certainty the data does not provide. It is better to state what the result includes and what it does not, and to add a missing cost only from a real source.
Four situations and what to do about them
| What the breakdown shows | What it means | Sensible next step |
|---|---|---|
| Volume, margin and margin after marketing all rise | Healthy growth | Consider accelerating and watch whether extra spend erodes margin after marketing |
| Revenue rises, average price falls or discount share grows | Growth bought with price | Review discounting and price level before the budget |
| Revenue rises, average margin falls because of mix | Growth in less profitable goods | Decide whether low-margin categories serve another purpose; shift support if not |
| Revenue rises, marketing costs rise faster | More expensive sales | Find campaigns whose extra revenue does not cover its margin and check whether new customers buy again |
What to do now
- Compare two periods of equal length and season. Calculate revenue, costs and margin excluding VAT, with cancellations and returns treated the same way.
- Calculate four numbers. Revenue, gross margin, marketing spend and margin after marketing. If margin after marketing grows more slowly than revenue, continue with the breakdown.
- Separate price, mix and volume. Compare average price, discount share and margin by main category.
- Set marketing against the store’s total margin. Not only against platform-credited revenue.
- Record what is missing. Do not estimate missing purchase prices or costs; state them next to the result.
Korzaro combines the store’s revenue excluding VAT, gross margin from purchase prices and spend from connected ad accounts for the same period. It shows revenue, gross margin, margin after advertising and true cost-of-sale side by side, calculated from the whole store’s revenue rather than platform-credited revenue. Margin after advertising is not net profit: Korzaro does not estimate shipping, payment fees or other operating costs into it.