
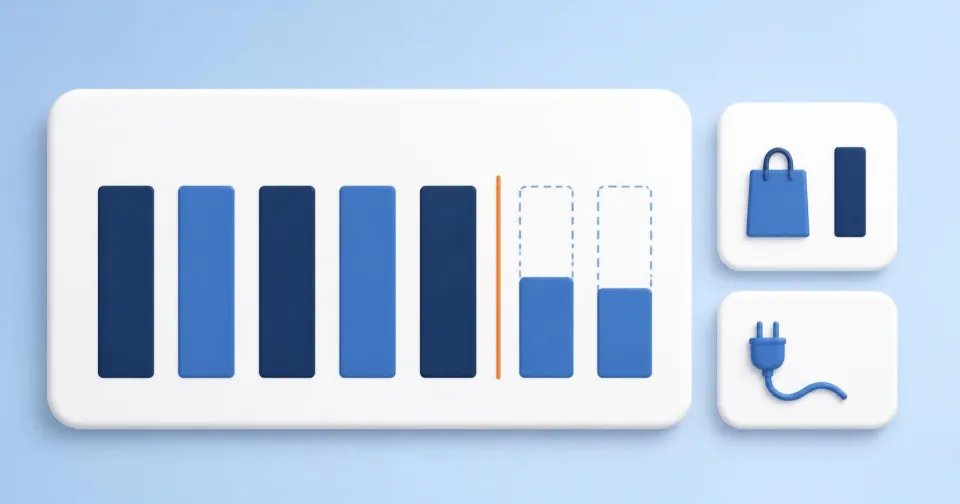
The fastest decisions are made on the freshest numbers – and those are the least reliable. Analytics, ad platforms and Search Console fill in the latest days with a delay, rewrite some figures after the fact, and the tracking code on your site can stop working without anyone noticing. Treat yesterday’s drop as a question about data completeness first, and only then read it as a change in the business.
Three different things that look like a drop
When the chart falls on the last day, one of three situations is behind it, and each calls for a different response.
| Situation | What happened | Right response |
|---|---|---|
| A real change | Fewer visits, orders or sales | Look for the cause in the business, marketing or website |
| Data still arriving | The source has not processed the latest hours or days | Wait for the day to close, change nothing |
| Broken or interrupted tracking | The business runs, but the tool cannot see it | Fix tracking or the data sync, not the campaigns |
The danger is mistaking the second or third situation for the first. Cutting a budget over a drop that was only incomplete data costs the store real sales. A campaign optimised on tracking that has stopped recording purchases is flying blind.
Every source catches up differently
The common assumption that “the data is there the next morning” is only partly true. The official documentation of each platform describes very different delays.
Google Analytics 4. In a standard property, intraday data typically refreshes within 2–6 hours and daily data within about 12 hours. Google also states that processing can take 24–48 hours and that report data may change in the meantime. Yesterday is often still open in the morning.
Google Ads. Most account statistics arrive within a few hours; conversions attributed with models other than last click are delayed by up to 15 hours, and goals imported from Google Analytics by 12 to 24 hours. The way credit is assigned matters more: a conversion is reported on the day of the click. If someone clicked last week and bought this week, the conversion appears last week. Recent days therefore look weaker than they will end up, and the longer customers take to decide, the more so.
Search Console. The newest data can be preliminary and may still change, so the default report shows complete days only. The last-updated date marks the last day for which the report has any data at all – not the day up to which all data is complete.
Meta. According to its developer documentation, ad insights refresh every 15 minutes and stop changing only 28 days after being reported. Recent days are not final even once you can see them in a report.
For decision-making, this leads to a simple rule: decide for each source when you consider a day closed, and read anything more recent as preliminary. Documented timings are typical values, not guarantees. For your own accounts, it is worth checking once how much a given day’s figure changed between your first look and a week later.
The latest visible date does not mean everything is complete
Reports that combine several sources – your own spreadsheets, agency reports or dashboards – usually show a single “up to date as of” date. That tends to be the date of the fastest source. Orders may be complete up to this morning, GA4 up to yesterday subject to further processing, Meta will keep changing for weeks, and one connector may have stopped fetching entirely three days ago.
Before any period comparison, therefore, check three things for each source:
- when it last loaded successfully – not when it last tried;
- which period it actually covers – the first and last day with data;
- whether it reported an error during the period – an expired login, denied access, a platform error.
Platforms also have their own logging outages. Google keeps a public list of known Search Console data anomalies. For example, for 24 June 2026 it recorded a decrease in clicks and impressions in the Discover report, noting that the issue affected data logging only. Actual traffic did not change; only what the report captured did.
Do you know how fresh your data is?
Korzaro tracks when each source last loaded and compares measured revenue with your store’s orders.
Missing data is not zero
The most common technical mistake happens mechanically: a day for which a source delivered nothing appears as zero in a table or chart. That zero drags down the weekly average, manufactures a dramatic year-on-year decline and, in an automated rule, can trigger an intervention.
Zero and a missing value mean different things. Zero says “measured, and nothing happened”. A missing value says “we don’t know”. Compare only days that are complete in both periods, and name the gap. “Meta data is missing for Tuesday and Wednesday” is more useful than a precise-looking weekly total that quietly counts those two days as zero.
The same caution applies to estimates. Do not fill missing days with the average of the surrounding days if you are going to make decisions on the result. After a few weeks, an estimate in the data can no longer be told apart from reality.
When tracking breaks, the business keeps running
The second kind of gap is more treacherous because it does not look like an outage. The source syncs normally and the data is “fresh”, but it captures only part of reality.
For a store on Shoptet, the Czech e-commerce platform, revenue data in Google Analytics depends on tracking code loaded on the store’s pages. When a customer declines analytics and marketing cookies, the code does not run; it can also fail to load on a slow connection or when a page is closed quickly. In the Czech Republic these cookies may be stored only with consent since 2022, so every change to the cookie banner, template, checkout or tag manager can change how much of your sales analytics sees at all.
Google offers diagnostics for its own tags that, among other things, flag untagged pages and mark as urgent a tag that used to send data but has sent nothing for the last 48 hours. The alert arrives with a delay, though, and does not cover other tools.
The most reliable check is therefore simpler: compare the measured figure with your order system. Orders in the store admin are created regardless of cookies and tracking code. If orders are within their usual range and only analytics or a single ad platform shows a drop, look for a tracking fault. If orders fall too, it is probably a real change.
Illustrative example (invented): On Monday morning, GA4 shows Sunday revenue 40% below normal and Google Ads shows half the usual conversions. Orders in the store admin for Sunday are within their usual range. The most likely explanation is unfinished processing and conversions that will still be credited to the day of the click. By Wednesday, Sunday’s figures look normal. An owner who cut the budget on Monday would have reacted to a delay, not to the business.
When to wait and when to act
Waiting does not mean ignoring. Some situations need a response right away – just a different one from what the chart suggests.
| What you see | Likely explanation | What to do |
|---|---|---|
| A drop only in the last day or two, orders carry on | Data still arriving or late conversions | Wait for the day to close for that source |
| One source reports an error or has not loaded for a long time | Interrupted sync | Restore access or the connection, then reload |
| Measured revenue has fallen against orders for some time after a site or banner change | Broken or reduced tracking | Fix tracking; review campaigns using automated bidding |
| Orders and measurement fall across sources | Probably a real change | Look for the cause in the business, offer or marketing |
One important exception: when conversion tracking breaks, automated bidding strategies start steering on incomplete data. Fixing the tracking is then urgent even if the business result itself is not on fire.
What to do now
- Define a “closed day” for each source. For example: orders straight away, GA4 after two days, Google Ads once the usual time between click and purchase has passed, Meta knowing that figures keep changing for weeks.
- Check completeness before comparing. For each source: last successful load, the period covered and any errors.
- Do not replace missing days with zero or an estimate. Compare only days that are complete in both periods, and state the gap next to the result.
- Set a tracking drop against orders. If orders carry on, look for the fault in the data, not in the business.
- Check tracking after every change to the site, template or cookie banner. One test purchase path and a comparison with orders over the following days reveal a problem before it affects a decision.
For each connected source, Korzaro records when it last synced successfully. It flags a source that returns an error straight away, and a source that has simply gone quiet once the silence exceeds twice its usual rhythm. It also compares revenue measured in GA4 with orders from Shoptet, so a drop in tracking alone can be told apart from a drop in the business. If the whole scheduled processing stops, the outage is reported only once it restarts.